
The Art of Data Science: Chapter Six
The Big Deal about Big Data
There was this meme that was doing the rounds a few years back.
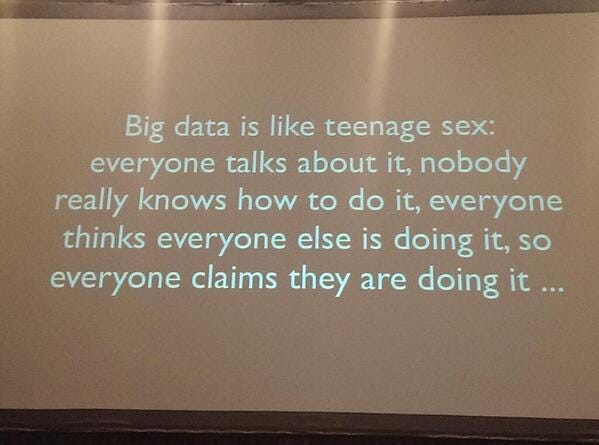
It has since fallen out of favour, though, since it is not entirely correct now. For starters, quite a few people are actually working on big data. Then, there are lots of people who actually know how to do it. What has not changed, however, is that everyone still thinks that everyone else is doing it, and that everyone wants to do it, whether it makes sense for them or not.
I've had clients tell me that they're looking for "big data solutions", but upon some digging I've found that the amount of data they have don't need "big data solutions" at all. And there have been a couple of potential clients I've lost because I've had the poor sense to tell them that the size of their data doesn't merit "big data solutions", and I've tried to sell them a simple solution instead.
So what is big data? A simple definition is that big data is data that is so large or complex that it can't be stored or processed on an ordinary computer (I consider my laptop with 8 GB RAM as an "ordinary computer"). And unless you've actually worked with large datasets, you'd be surprised to know how much data can actually be processed on an "ordinary computer" - for example when the data is structured in the form of a conventional relational database, even tens of millions of records can be easily handled on an ordinary computer.
In other words, in order to merit "big data solutions", you'll need to have lots and lots of data. And trust me, label aside it's not a privilege. Having to store or process your data across multiple systems might mean significantly slower processing, significantly more complex algorithms and less chances of simply playing around with the data.
In other news, I'm currently in the process of re-reading this book on Big Data algorithms that had been first recommended to me back in 2014. It's by Jure Leskovec, Anand Rajaraman and Jeff Ullman, and simply called "Mining of Massive Datasets".
This book is something I'd definitely recommend that you actually read end-to-end if you're interested in big data algorithms. They take popular big data algorithms such as MapReduce, Market Basket Analysis, Page Rank and Collaborative Filtering and explain it in a rather intuitive format. They talk succinctly about the difficulties in storing and processing data across multiple CPUs, and how the respective algorithms can be suitably modified to work across several processors. And they manage to keep it readable without sacrificing rigour.
The free PDF is available here.
A couple of pertinent observations from the very beginning of the book:
1. The phrase "data mining" initially had derogatory connotations. It is only in the last few years that people have used it as a constructive phrase
2. The authors claim that "... machine learning has not proved successful in situations where we can describe the goals of the mining more directly". Mull over this.
Training and Test Datasets
One big problem with machine learning methods is the concept known as overfitting. This diagram illustrates what the problem looks like.

Basically what we've done in this case is to build a model that just fits the data that we have. While this is excellent for classifying the data with which we've built the model, it's not hard to see that this model doesn't work very well for data from outside the modelling set. Given that the boundary between the red and green dots has been drawn in such a complicated fashion here, it is virtually impossible to classify a previously unseen point that lies somewhere along the boundary.
In order to guard against this problem, the standard practice in machine learning is to look for "out of sample performance". What this simply means is that you make sure that whatever model you build works well on data that the model has not been trained on. The way this is typically done is to split the input dataset randomly into "training" and "test" datasets. The model is built (I'm specifically avoiding the word "trained" here, since it makes it sound more complicated than it is) using the training dataset and then tested on the test dataset. If its performance is great on the training dataset and bad on the test dataset, it indicates overfitting, and you possibly simplify the model after that.
Of course this gives rise to another problem - that your model might have been too optimised for the combination of the training and test datasets that you have. It goes like this - you iteratively built the model on the training dataset and tested it on the test set until you got satisfactory performance. There is no guarantee here, though, that your model will do well on a third dataset.
And so people have come up with the "training-validation-test" method, where the data is broken into three. Model is built using "training set" and iteratively tested on the "validation set". Finally, the test set is used exactly once to know the final quality of the model - once you've tested the model on this dataset, there is no going back - you're not allowed to rebuild the model again!
Blockchain Blockchain Blockchain
The headline comes from the excellent Matt Levine, who I've mentioned earlier in this newsletter. In the last two weeks I've spent time reading this excellent book on Bitcoin by Arvind Narayanan and others from Princeton University. The book is extremely well-written and if you want to use blockchain/bitcoin as part of your work I urge you to read it (free PDF available). A couple of pertinent observations for now:
1. I compared the working of the blockchain to a school-kid fight. You can read the entire post here on LinkedIn
2. Bitcoin implements privacy in a rather unique manner. The list of transactions using blockchain is actually public, and you know which bitcoin has been used where and when. Privacy is implemented at the next layer - you don't know which User IDs map to whom. You can know which UserID has owned which bitcoin, and done what transactions in history, but you can't easily map that user to a real-life entity. Fairly interesting!
Chart of the edition
For a change, the chart of the edition is not something I came across on Twitter. It's something that a reader of this newsletter sent me in all seriousness, as part of a discussion on technology and AI and machine learning that we were having. It's from this Forrester report.

At the outset, it's a bunch of line plots but so many complex elements have been introduced into it that it makes it rather unreadable. Firstly, the axes in a line plot need to be numerical. In this case they are not, though the saving grace is that there is a natural order to the categories on both the X and Y axes. Secondly, there are these alternating grey and white bands whose purpose I'm not very clear about. And then there are these tape recorder buttons for each data point. All in all, it's rather confusing, and it takes too much effort on the part of the reader to understand the graphic.
Related to this, I'd gone on a Twitter rant a few weeks back about how management consultants create slides that seem to contain so much, but ultimately say little.
Me in other places
On the 29th of June, I participated in a panel discussion hosted at the SAS offices in London on "the future of analytics". The event was recorded on video and the organisers mentioned it'll be shared but it's not yet happened. Anyway, I spoke about how in the craze for "machine learning" and "deep learning" and so on, people are vastly underestimating the value they can get from rather simple techniques such as averaging and visualisation. One of my co-panelists spoke about how when you actually consider implementation, simpler models do better. It was a fun discussion, no doubt helped by the availability of ethanol in the pre-event thingy.
For Mint On Sunday, I wrote about how before we jump to conclusions using data, we need to stop and look at how the data was actually collected. I also used the piece to talk about the media's "spectacularness bias" and about narratives. Read the whole thing here.
That's it for now. Keep the feedback coming. And share this newsletter with whoever you think might find it interesting. They can subscribe to it here.
Cheers
Karthik