
The Art of Data Science: Chapter Nine
Ever since I started this newsletter, and included a "visualisation of the edition" section in it, readers have been writing to me every time they've seen an interesting visualisation. Some of these visualisations are brilliant, others are atrocious. But most are simply "interesting". I've included several of them in subsequent editions of the newsletter, but this time round the sheer volume of interesting visualisations and related stories I've collected is so much that I'm dedicating this entire issue to that.
Before that, though, just a reminder that my book Between the buyer and the seller is available for sale on Amazon. It is also listed by Business Today among the "best reads in business / management".
The art of visualisation
Tracy Alloway of Bloomberg (who incidentally interviewed me for the Odd Lots podcast) recently tweeted this stock market chart saying that she wanted to print and frame it as modern art.
Check out the graph. It is simply a piece of art:
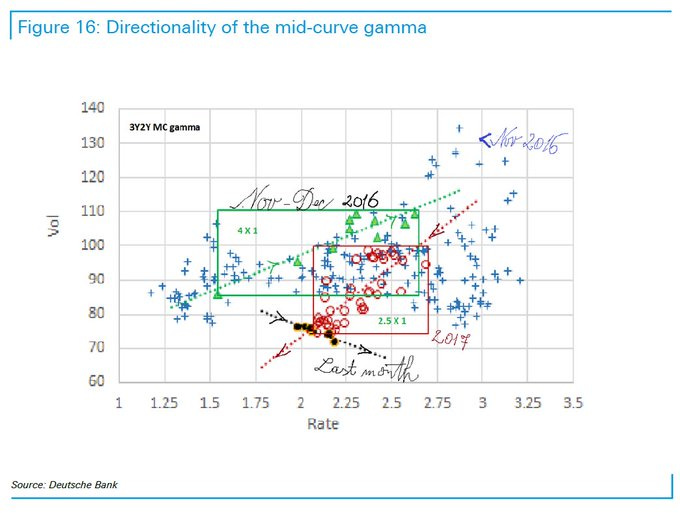
I won't go into what it's trying to show, but what makes it a "piece of art" is the use of various colours and markers for the scatter plot points. On top of that, you have some squares and trend lines and so much other data that there is very little actual information that you can actually make out from the chart. And for added effect, there are also some scribbled notes - with some dates and something saying "last month" all of which simply add to the confusion.
One good thing about bankers is that unlike a lot of people, they get scatter plots. But the problem is that you sometimes get gems like this one, which are so full of data that it is next to impossible to get any information out of it! Oh, and it turns out that the "artist" is pretty famous in banking circles for putting out pieces of art like this one.
All this talk about stock market charts as art reminds me of this artist called Sarah Meyohas who actually produces art (while intending to do so) in the form of stock market charts.
The only little problem with her art being that, as Matt Levine has written multiple times, she has engaged in manipulating penny stocks (thinly traded low value stocks) so that their prices would form patterns that look, well, artistic.
The Economist's charting style
Now for some more serious stuff. The Economist, which is well known for useful well-made and thoughtful visualisations, has released a note with guidelines on how they produce their charts. It's mostly very good information, and since it's in the form of an image on Twitter, I'm posting it here in full (thanks to reader Manish Achuth for pointing me to this chart).

Read this carefully. All the advice here is excellent, including the positioning of labels, gridlines, colour scheme etc. And the "signature" (red rectangle in the case of the Economist) is also rather important, since it allows you to keep credit when a graph gets shared. I don't have anything to add here.
Except that the Economist is also capable of coming up with charts that make absolutely no sense and which evidently break all the rules they've set out in the above picture. Check out this chart, sent in by reader Thejaswi Udupa:

The article is about a Tuna market, and the graph has been made to look like a tuna, but apart from that it doesn't convey any information at all. It's supposed to be a scatter plot, but the points themselves are invisible, and it is hard to understand why the dots are connected the way they are. It's basically a pointless chart.
Chartmaking tips from a government agency
The Economist is not the only organisation doling out advice on how to make charts. The UK Office of National Statistics is also at it. And their advice is also very good. It even goes down to the size of the charts you need to use and the size of the font of the writing on it. It is a long article which liberally makes use of examples (both positive and negative) to illustrates what makes for a good and bad graph. I don't want to quote anything specific from it here, but I urge you to click through and read it.
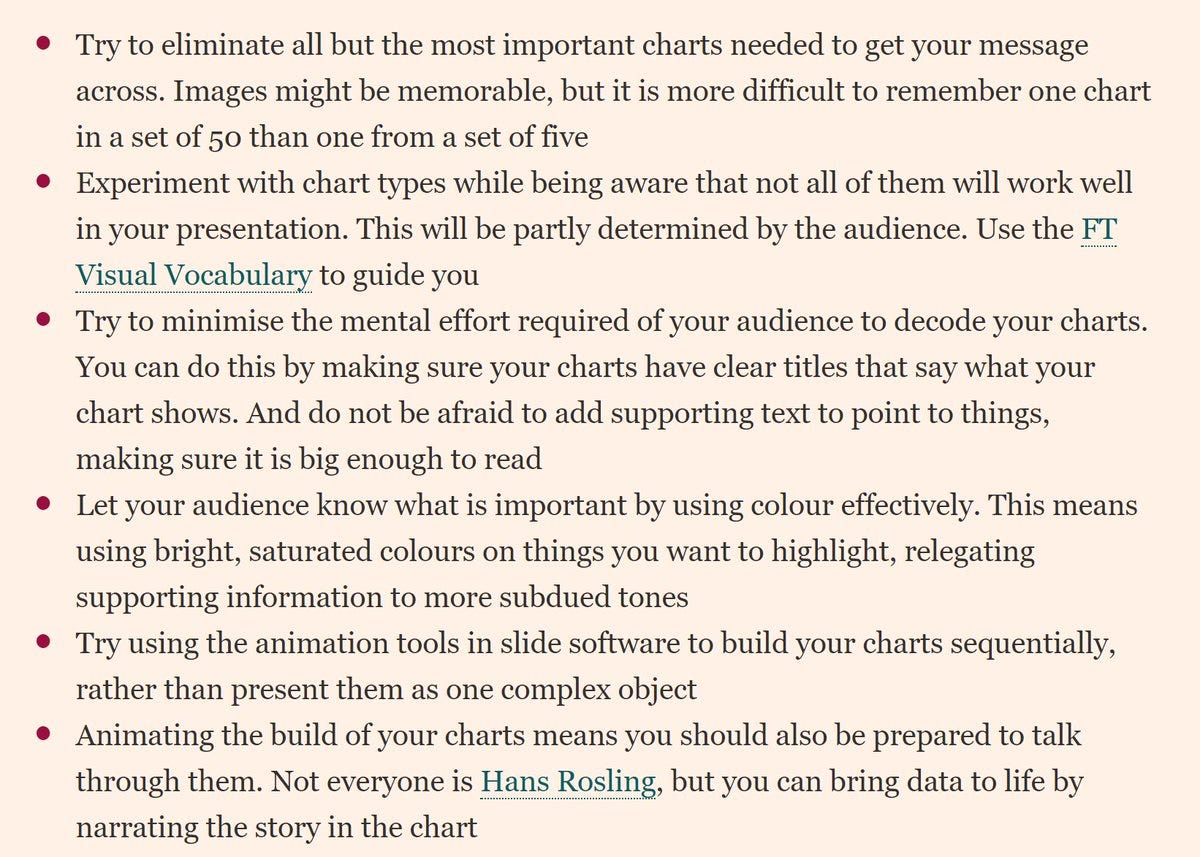
Not to be outdone, the Financial Times has put out a feature on "how to keep your audience awake during a PowerPoint presentation" (possibly behind paywall). Written by their "data visualisation editor" Alan Smith, it has some useful tips on visualisation:
Justin Wolfers and small multiples
One of the chart examples that the ONS guideline proposes is called "small multiples". Basically, when you want to show trends time for a large number of categories, a line graph doesn't scale. Once you have too many lines on the graph, there is little information that you can get in terms of how any particular line moves, and your graph will simply be a maze of lines rather than conveying any useful information.
One way to get around this problem is by using a solution known as "small multiples", where rather than having one line graph with lots of lines, you have lots of line graphs with each holding only one line. This way, the information in each line gets its own highlight, and the graph becomes significantly more readable. Here is a great example of the use of small multiples that shows alcohol consumption. Click through to read more about why it's such a great plot.
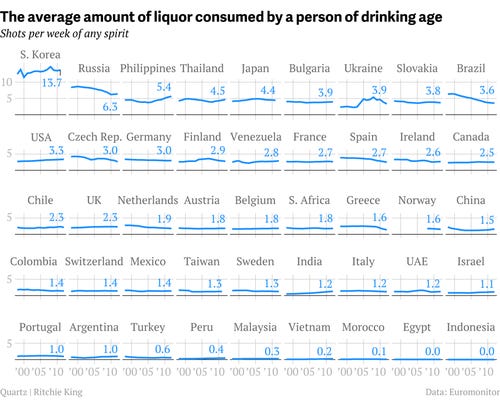
As you can see, one chart with lots of lines is replaced by lots of charts with one line each. Careful labelling also means that it makes different components easy to compare. In some ways, these lines are similar to "sparklines" that are available on Excel - they show the trend for a single category and allow you to broadly compare across categories.
One problem with such a graph, though, is ordering. Since you usually have a lot of "facets" (using the term that R uses for this kind of a layout), the order in which you place the categories becomes important. On the one hand, you want the ordering to make some kind of logical sense so that the reader can quickly and easily find the category they're looking for. On the other, you want the ordering itself to contain information on the data - such as in the above graph which is in descending order of liquor consumption.
One innovative solution for this comes from economist Justin Wolfers, who has used the style of a US map to draw a small multiples kind of plot for unemployment rate by state. Rather than placing the small multiples in a grid as is convention, Wolfers has placed them in a configuration that broadly resembles a map of the US.
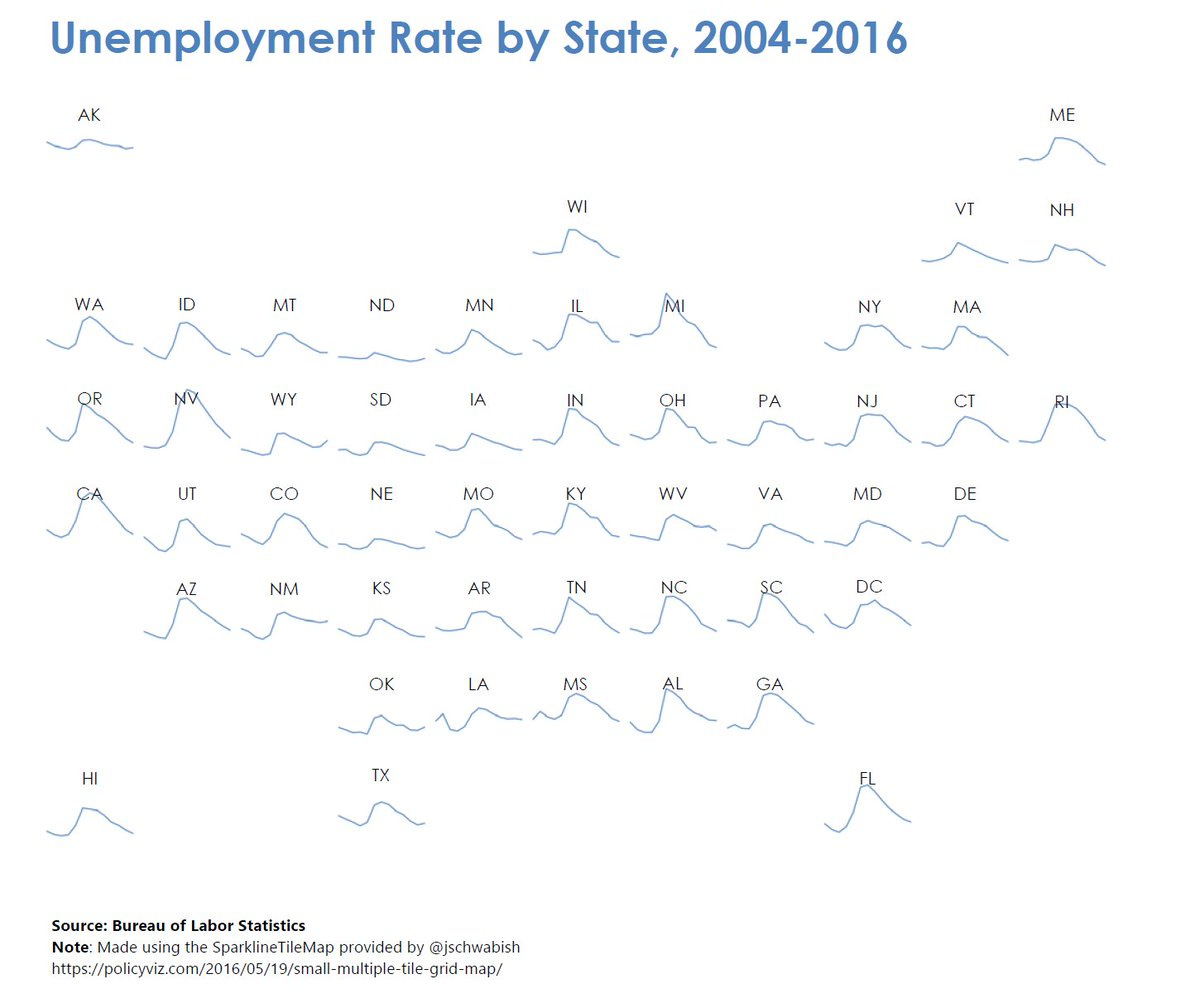
There are several advantages to this configuration. Firstly, the overall shape looks familiar - and this can prevent readers from switching off. Secondly, it allows for easy comparison across sets of neighbouring states, and that can help detect if there's a geographic pattern to the overall data. Thirdly, usage of the two-letter codes for states makes the graph intuitive to se without leaving it too cluttered.
I guess that will be it for now. In the next edition, I will talk about the continued battle between R and Python, and working on high dimensional datasets among other things!
Recommendation
Keeping up with the spirit of the topic of this newsletter, the book recommendation for this edition has to do with visualisation - all of Edward Tufte's four books on the topic are being sold as a package. His book visual display of quantitative information is a holy book among visualisation practitioners. I've read it myself and like the way he breaks down complexity.
The other books also come highly recommended. You can find them all here, and you should buy them if you're willing to spend/invest that kind of money and are interested in visualisation.
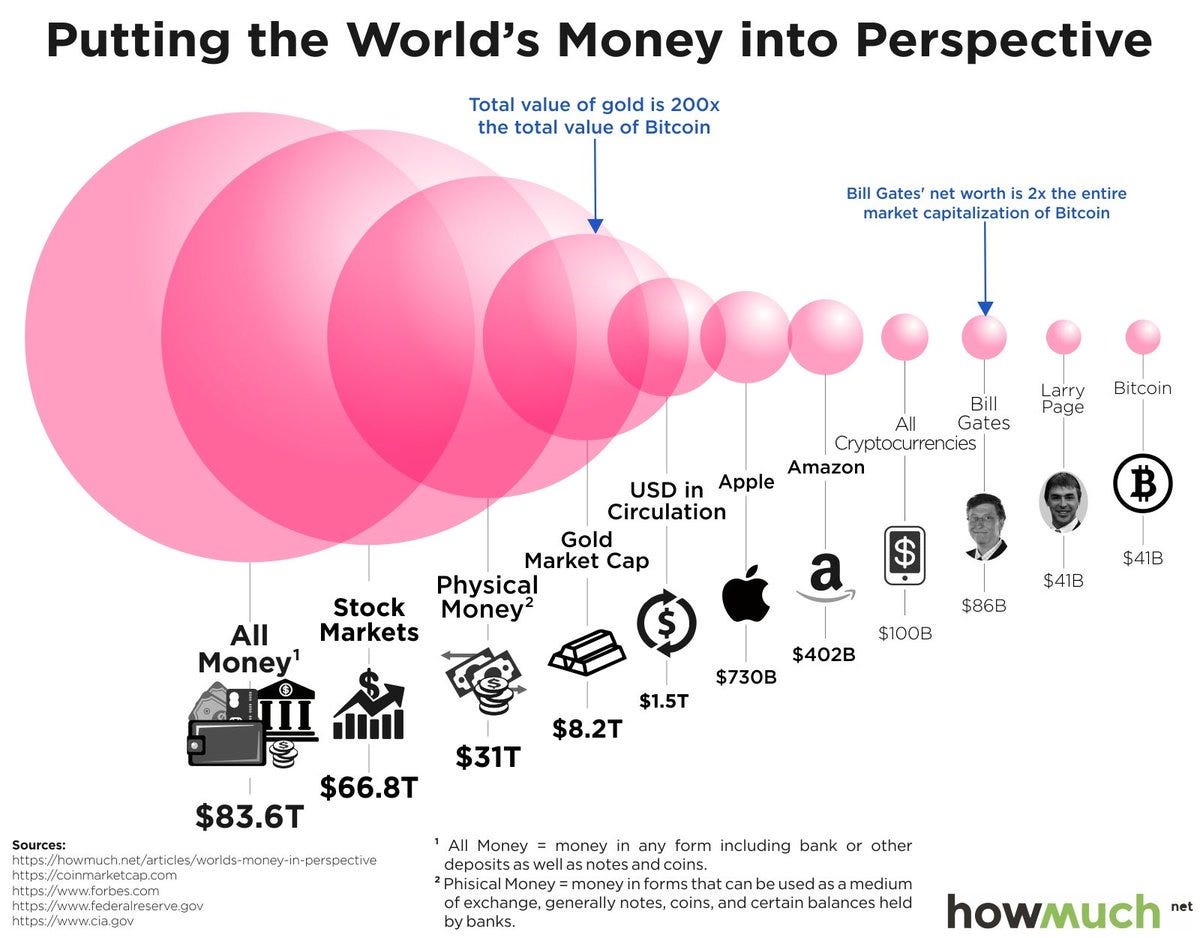
Finally, I'll leave you with this picture (or is it art?) that I got on twitter. I was commenting on some fallacious comparison of Bitcoin "market capitalisation" to the actual market capitalisation of companies like Goldman Sachs. And follower Shruti George sent me this:
Enjoy
Karthik