


Season 3, Episode 2: Look at the data
In all the fancy models and dashboards we build, we data scientists sometimes forget the very basics - which is to look at the data!
It is funny how you decide to pontificate about something to your readers, and you yourself fall lock, stock and barrel for the same thing!
In the spirit of the new season of the newsletter, I wrote most of this edition some ten days back, advising all of you that you need to look at the data if you want to be an effective data scientist.
And then it happened this afternoon - debugging a particularly troublesome model, I found the problem with my approach. I had got so caught up in modelling this model that during the last few iterations, I had simply failed to look at the data. And had thus allowed some unwanted bugs to creep in.
Anyway, read on!
Spin the ball
In one of his several books on cricket (I now forget which one), Ramachandra Guha writes about his encounter with Bishan Singh Bedi at his uncle’s house in Bangalore. At the time, Guha was a student at Delhi University while Bedi was already at his peak, playing for India.
Guha’s uncle introduces him to Bedi saying “this boy is an off-spinner for Delhi University”. And then Bedi immediately says “whatever you do, just make sure you spin the ball”. I’m of course paraphrasing from a book I had read long ago, but Guha keeps talking about his technique, line and length, variations, etc. But Bedi just keeps telling him, “all this just doesn’t matter if you don’t spin the ball. So at your age you should just focus on that”.
It is a profound lesson. Sometimes, when we read advanced material, or learn from masters, we focus too much on the “advanced content” and can sometimes forget the basics.
Counter-signals and imitation
Of late, I have become a fan of Rob Henderson. I discovered him just about a year back when he appeared on a podcast with Jim O’Shaughnessy. Henderson is a Korean-American who was put in a foster home when he was very young. And then he got adopted, his adoptive parents broke up, and his life got into all kinds of shit. In any case, he finally joined the Air Force, then graduated from Yale and has just finished a PhD from Cambridge.
One of Henderson’s most foundational blogposts is one on signalling and counter-signalling.

Since reading it, I have just been “unable to unsee”. I see examples of signalling and counter-signalling everywhere.
In any case, the reason I brought up Rob Henderson is that he has another very strong post on counter-signalling.
Basically, “high status” people can afford to counter signal.
Successful people can afford to engage in countersignaling—doing things that signal high status because they are associated with low status. It is a form of self-handicapping, signaling that one is so well off that they can afford to engage in activities and behaviors that people typically associated with low status.
An example from Ogilvy Vice Chairman Rory Sutherland: If you’re a top executive, turning up to work on a bicycle is a high-status activity because it was a choice and not a necessity. But if you work at Pizza Hut, turning up on a bike means you can’t afford a car.
And so, Henderson’s point is that if you try to imitate high status people, you might end up imitating their counter-signals, which for your level, might be massively counter-productive.
Look at the data
Yes, this is a newsletter on “the art of data science”. It is just that occasionally I like to give “good buildup” (and generally I overdo it).
Junior Data Scientists
Data science is a fairly young profession, maybe ten or fifteen years old (depending on how you count). While data science courses and degrees are dime-a-dozen nowadays, many of them are not particularly reputable (OK - I tend to ignore them on people’s CVs). So most people getting into data science learn the subject by reading what others have written, (hopefully) looking at others’ code, from online lectures and MOOCs, etc.
In the past (on my blog) I have written about how a lot of data scientists simply “remain junior”. The idea there is that a lot of material online for data scientists is aimed at beginners, and most data scientists simply don’t get past that. Also, sometimes have entire organisations of data science consisting of beginners (with one of the said beginners in a nominally senior role).
While a lot of the material for data scientists is meant for beginners, the picture they give of data science is not necessarily representative. For example, there was a time when everyone who learnt data science through Andrew Ng’s MOOC would implement support vector machines for whatever problem they were looking at.
Courses emphasise on statistical or machine learning techniques. Blog posts talk about “good practices in data science”. You find material on how to put data science into production. There are SOPs on good coding practices for data scientists. You see language flamewars.
The problem is that when people with slightly advanced knowledge or experience of data science write, they write about the “uppermost layer of the stack”. Whatever they have internalised they just take it for granted, and write about what they have just learnt (I do this ALL the time). Which means you don’t find that much material about the “basics”.
There is very little material about what Bedi told Guha - “spin the ball”. Instead, all the material is about “line and length”, variations, etc.
The data science equivalent of that is to “look at the data” (yes, I have a blogpost already on that as well. Maybe this newsletter should just be about rehashing all my old blogposts about data science).
Why you need to look at data
It is hard to overstate the value of looking at data (especially if you are working with small-dimension data). Patterns can become apparent. Anomalies in the data can be easily figured out (and hopefully corrected for). Models can be understood and debugged more easily. You get a better idea of what each column means. You know what the difference between columns is.
My favourite story is from 15 years ago, when excel-shy bosses urged me to build a forecasting model in java (!!!). I struggled for 6 months with tonnes of bugs and nowhere close to good forecasts. One day, fully frustrated, I loaded the data into Excel, and the solution (or the lack of it) was right in front of my eyes.
From another perspective, looking at data grounds you. It opens up your model (to the extent possible), and helps you explain the solution to the extent possible (unless you are operating in high dimensions). Overall, looking at data is like exposing your data to sunshine! Actually - I should talk about today’s experience on how looking at data helped.
Illustration from today: There is this model at work that I’d been looking to debug for a long time now. Under certain conditions, it was giving highly suspicious results because of which I hadn’t been able to convince people about the model, and I had had a lot of trouble trying to figure out what was wrong.
And then, breaking my head this afternoon I figured out what the issue had been - this model has been so long in the making that of late I had completely ignored looking at the data. Because I hadn’t looked sufficiently at the data, I hadn’t bothered asking sufficient questions of the model. Thus, I had built a model that had failed to convince a lot of people.
It started by looking at a table sorted in a particular manner. Something fishy appeared. Then I made a quick histogram, and the outliers were more visible. Through the course of the afternoon I furiously alternated between drawing pictures to examine the data and fixing the model (I used at least two sets of histograms, a boxplot, a faceted scatterplot and a sorted table to debug my model).
While I’m happy I’ve dealt with most of the bugs, I’m kicking myself for missing something so basic - looking at the data.
The scourge of “EDA”
It is only about a year ago (a full decade into my career in data science) that I first came across the phrase “EDA” (no, it doesn’t have anything to do with EDM). Apparently it stands for “exploratory data analysis”, and is popular among a lot of data scientists.
Except that by becoming a three letter acronym, it has become something that only lip service is paid to. “Explore your data and understand it before building models”, the books and MOOCs will say. Since “EDA” has become a thing, people just do a standard set of analyses on the data they have and then just jump into the model. In most cases, there is little to connect the “EDA” and the model.
“Doing EDA” is like praying to Ganesha before you pray to whichever god you were actually supposed to worship.
For those of you not on the dark side yet, the “standard EDA toolkit” consists of looking at summaries of all columns, checking for missing data, making sure the data types are what you intend them to be and one or two more steps. Conscious by their absence (not easy to “teach” or simplify) are steps in actually looking at data - simple histograms and scatter plots, for example. Or just looking at the data table itself, sorted in different ways.
Which brings me to..
Why don’t *data* scientists look at data?
Looking at data is more of an art than a science. It can’t be easily taught. There is no procedure or algorithm to be followed in looking at data. Sometimes you can just spend hours staring at the data without any “insight” whatsoever. Figuring out what kind of model to use after you have looked at the data is again an imperfect science (and can’t be easily taught to beginners).
It has been a while since I put this picture somewhere.
And as I (re)discovered this afternoon - looking at the data is not something you only do at the beginning of an exercise. You need to always be looking at the data. It is like taking a catch in cricket - data is the ball that you need to keep your eyes on.
Other Material
I recently came across this podcast on Chat GPT / Stable Diffusion / etc. It is Patrick O’Shaughnessy interviewing Jeremiah Lowin of Prefect. It reminded me of a lot of stuff that I had once internalised but then forgot about.
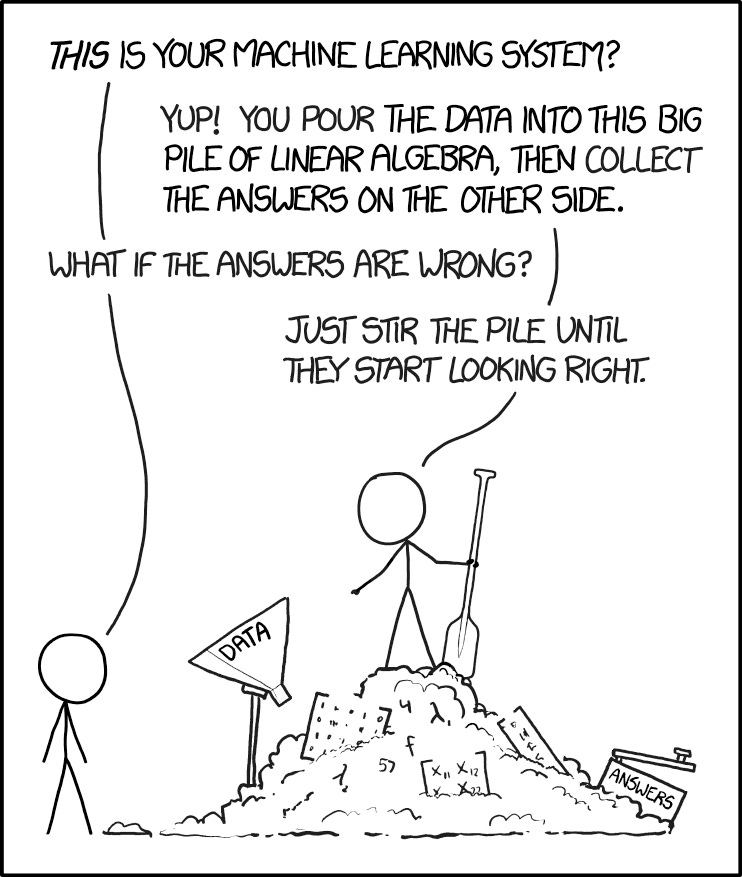
Like AI models basically being large mathematical formulae, with training data basically being about “tying down the coefficients of a ML model”.
Via LinkedIn I came across this graphic:
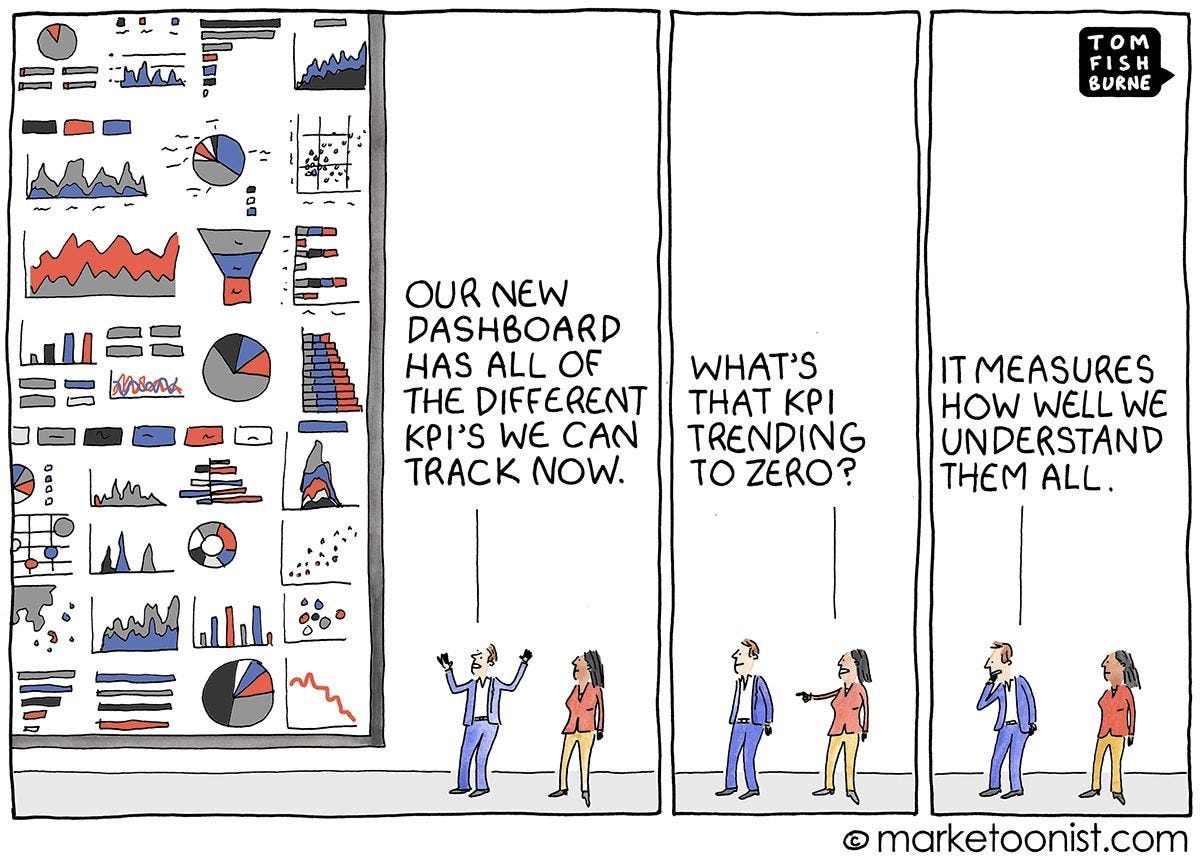
Speaking of dashboards, did you know that they were invented in Chile in the early 70s during the government of Salvador Allende? So that effectively makes the dashboard a tool of central planning!
Excellent post. 'Looking at data' was such a gamechanger for me. Thanks for putting it like this.