Agentic DataViz
I conducted a workshop on this topic last week. All the material here.
That was the title of the workshop I conducted as part of the excellent VizChitra conference in Bangalore last week. The workshop had a capacity for 30 people, and the organisers ended up selling out all tickets.
I think it went well, and the reviews were positive.
Like I always do, I taught using first principles, and emphasised that data visualisation is only the last step of a “scientific” hypothesis-driven process to analyse data. And with benefit of hindsight, we ended up spending too much time in building a skill on how to analyse data (given a dataset and question), leaving less time than desired for building the skill on how to actually visualise the data.

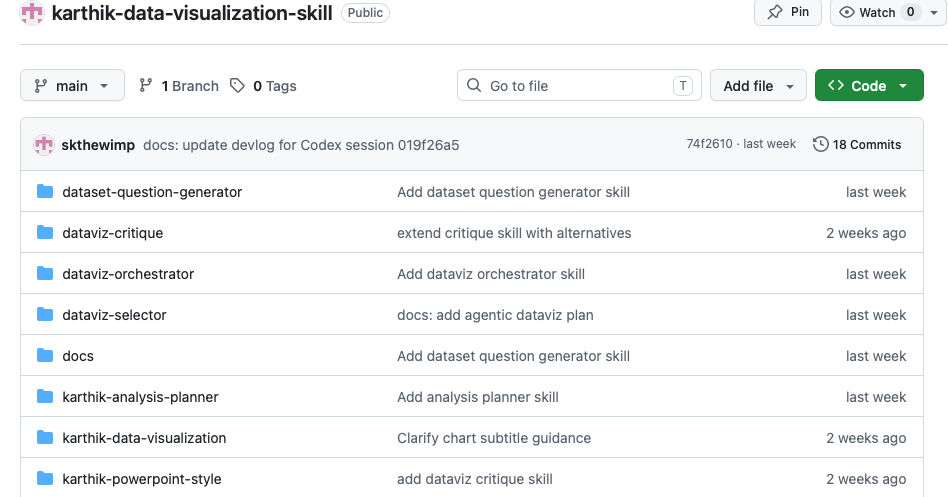
In any case, I’ve shared all the material for the workshop here on my Github (including the presentation etc.). One of the participants was kind enough to have Granola turned on through the session (and share the transcript with me), so I’ve included that also in the repo.
Post my session, I’ve been approached by a couple of corporates to conduct similar workshops for them. They should happen later this month.
In any case - if you want me to do a session for your company either on this topic (agentic dataviz), or something related (anything in the AI x Data space - for now I’m happy to customise), let me know. I’ll happy to come over.
For now, check out the suite of data-related skills that I’ve built to do better data analysis using LLMs.